Goals
- Explain the components that make up the IT network
- Access our factory data from the IT zone
- Use our factory data to create a dashboard
Systems
Our IT section is much simpler, with only one application running (well, plus Caddy). Again, it’s all run using Docker Compose:
name: it-homelab


volumes:
  grafana-data:
  caddy-data:
  caddy-config:

networks:
  it-stack:
    driver: bridge
    internal: false

services:

  caddy:
    image: caddy:2-alpine
    container_name: caddy-it
    restart: unless-stopped
    ports:
      - "80:80"
      - "443:443"
      - "443:443/udp"
    volumes:
      - ./caddy/Caddyfile:/etc/caddy/Caddyfile:ro
      - caddy-data:/data
      - caddy-config:/config
    networks:
      - it-stack
    healthcheck:
      test: ["CMD", "caddy", "version"]
      interval: 30s
      timeout: 10s
      retries: 3

  grafana:
    image: grafana/grafana:13.0
    container_name: grafana
    restart: unless-stopped
    ports:
      - "127.0.0.1:3000:3000"
    volumes:
      - grafana-data:/var/lib/grafana
      - ./grafana/provisioning:/etc/grafana/provisioning:ro
    environment:
      GF_SECURITY_ADMIN_USER: ${GRAFANA_ADMIN_USER:-admin}
      GF_SECURITY_ADMIN_PASSWORD: ${GRAFANA_ADMIN_PASSWORD}
      GF_SERVER_ROOT_URL: https://grafana.home.lab
      GF_SERVER_DOMAIN: grafana.home.lab
      TZ: ${TZ:-Europe/London}
    networks:
      - it-stack
    healthcheck:
      test: ["CMD", "curl", "-f", "http://localhost:3000/api/health"]
      interval: 30s
      timeout: 10s
      retries: 5
      start_period: 30s
Caddy
As mentioned in the UNS build article, Caddy is used as a reverse proxy to serve the web interface of the application over a nice clean *.home.lab domain. It also provides HTTPS via the local CA.
Grafana
Grafana is used to serve dashboards fed by the data historian. It’s a popular application for this use case and is, therefore, well documented online. It supports a number of different ways of ingesting data, which we will look at further below.
We configure the login for Grafana via the .env file where we place a username and password.
TZ=Europe/London
GRAFANA_ADMIN_USER=admin
GRAFANA_ADMIN_PASSWORD=password
Once Grafana and Caddy are up and running, we can start to access some data via Grafana. Note: Grafana reaches down into the DMZ to get the data, rather than the data being pushed up to Grafana. This means, when we set up our firewall later, we’ll want to configure it so that Grafana can establish a connection with the historian, but not vice versa.
Accessing Data
This won’t be a fully comprehensive guide but it should give you some pointers if you want to copy me.
We start by accessing Grafana via a browser and logging in with our above set credentials.
Then we can go Connections -> Data Sources -> Add new data source.
Grafana supports InfluxDB out-of-the-box, so a quick search for ‘InfluxDB’ loads the add-on. If you can’t see it, go to Connections -> Add new connection and search for InfluxDB there. Install it and try again.
We can then configure our new data source with the following:
- Query Language: SQL
- HTTP -> URL: https://172.16.1.10:8181 <– Our historian
- Database: homelab
- Insecure Connection: True
(We set insecure connection as true because a) it’s easier to set up that way and b) if gives us more attack vectors to play with in the future!)
Next, hit ‘Save and Test’. If it works, it works! Now, we can create a dashboard.
Creating a Dashboard
Again, creating Grafana dashboards is a well documented process, so I won’t dive too deep into it here, other than to show you what I made.
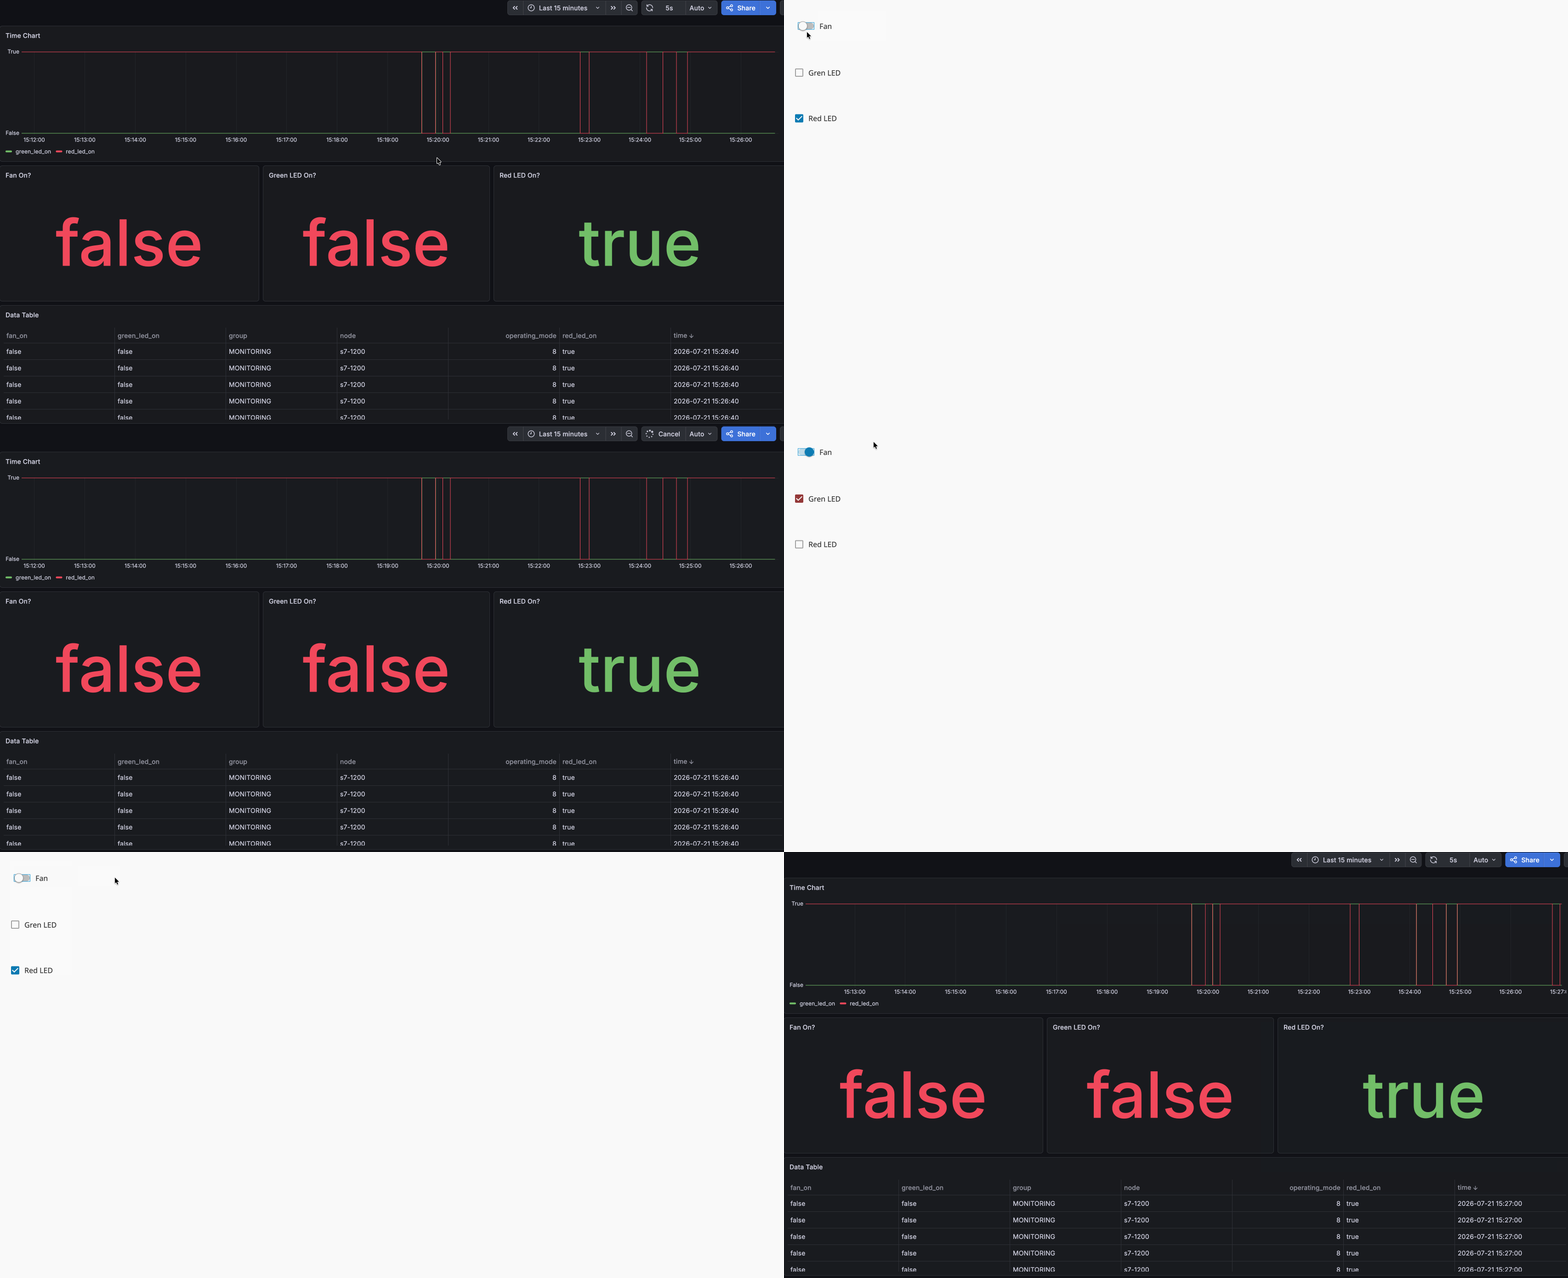
As you can see in this, slightly stuttery, GIF above, when we use the HMI to make changes to the PLC data, they are nearly immediately reflected in the dashboard (give or take the 5s auto refresh window in Grafana + some latency).
From here, we can easily monitor the status of the lights and fan, as well as quickly see how the lights have changed over time, and get a detailed view of data in the table at the bottom.
I’ll admit - it’s not the best dashboard I’ve ever created, but for our labbing purposes, it does the job very nicely.
Final Thoughts
In this, much shorter, article, we’ve had a look at the IT side of the network and how we can feed read-only data up the line to be used by the business without risking any write backs.
In the next article, we’ll start looking at attacks, starting with scanning OPC-UA servers for security settings and writeable tags!