- Goals
- What is SCADA?
- What is a Historian?
- Why OPC-UA over Modbus for SCADA?
- Systems
- Viewing Data
- Final Thoughts
Goals
- Understand what SCADA and historians are and why they matter
- Stand up Ignition as the SCADA/HMI for the lab
- Stand up InfluxDB 3 Core as the historian, fed from the UNS
- Get live PLC data visible in a dashboard and stored for historical queries
What is SCADA?
Supervisory Control and Data Acquisition (SCADA) refers to software that sits above your PLCs (or RTUs, or whatever else you use to control your level 0), and lets you see (Supervise) what’s happening on the plant floor. It can also be used to interact with (Control) devices where permitted and gather (Data Acquisition) information about the goings on.
What is a Historian?
A Historian is a time series database that stores tag values over time. It allows you to have a historical view over how your data has changed over time. This comes in handy for businesses when doing analysis work, since they can essentially pull a snapshot of the factory for any time period they need.
Why OPC-UA over Modbus for SCADA?
We touched on OPC-UA in the last article, but I want to take a moment here to look at why we would use it for SCADA over something like Modbus. Modbus is simple. It works fine as intended. It’s still used on many sites. But it’s old. It’s extremely basic, you have to know your mappings of holding registers, you can’t browse any information. It has no authentication and a myriad of other security risks.
OPC-UA can do much more. You can browse the tags, give them meaningful names and data types, subscribe to data rather than just spam reading it. It also has a lot more security options built in like certification or account authentication, message signing, and encryption.
Modbus still has its place, and we’ll explore some attacks around it later in this series, but for our homelab, we’re picking OPC-UA to get more familiar with the modern conveniences and security measures that it offers.
Systems
SCADA (Ignition)
Connecting to the PLC
Ignition connects to the PLC’s OPC-UA server where specific tags are exposed. These tags can be read, subscribed, or written to, giving Ignition the ability to control the system, not just supervise and acquire.
I already covered setting up the OPC-UA server in this post, so let’s look at how we get Ignition talking to it.
- We start by logging into the Ignition web portal using the credentials we set during deployment (admin:password (very secure!!)).
- Next, navigate to Connections -> OPC -> Connections and click Create OPC Connection. Select OPC UA Connection and click next.
- Enter the Endpoint URL. This will be our PLC IP with opc.tcp:// prepended and the OPC UA server port on the end (4840 by default).
opc.tcp://10.0.0.10:4840
- Click next, and if the connection was successful, you should see some information come back about the server.
- I selected None for Security Policy and Security Mode. Of course, this is a bad idea.
- Confirm your connection and click Next until you get to step 6.
- Give it a name and make sure the Enabled checkbox is ticked. Set Authentication Type to Anonymous (again, bad idea!) and click Create OPC Connection.
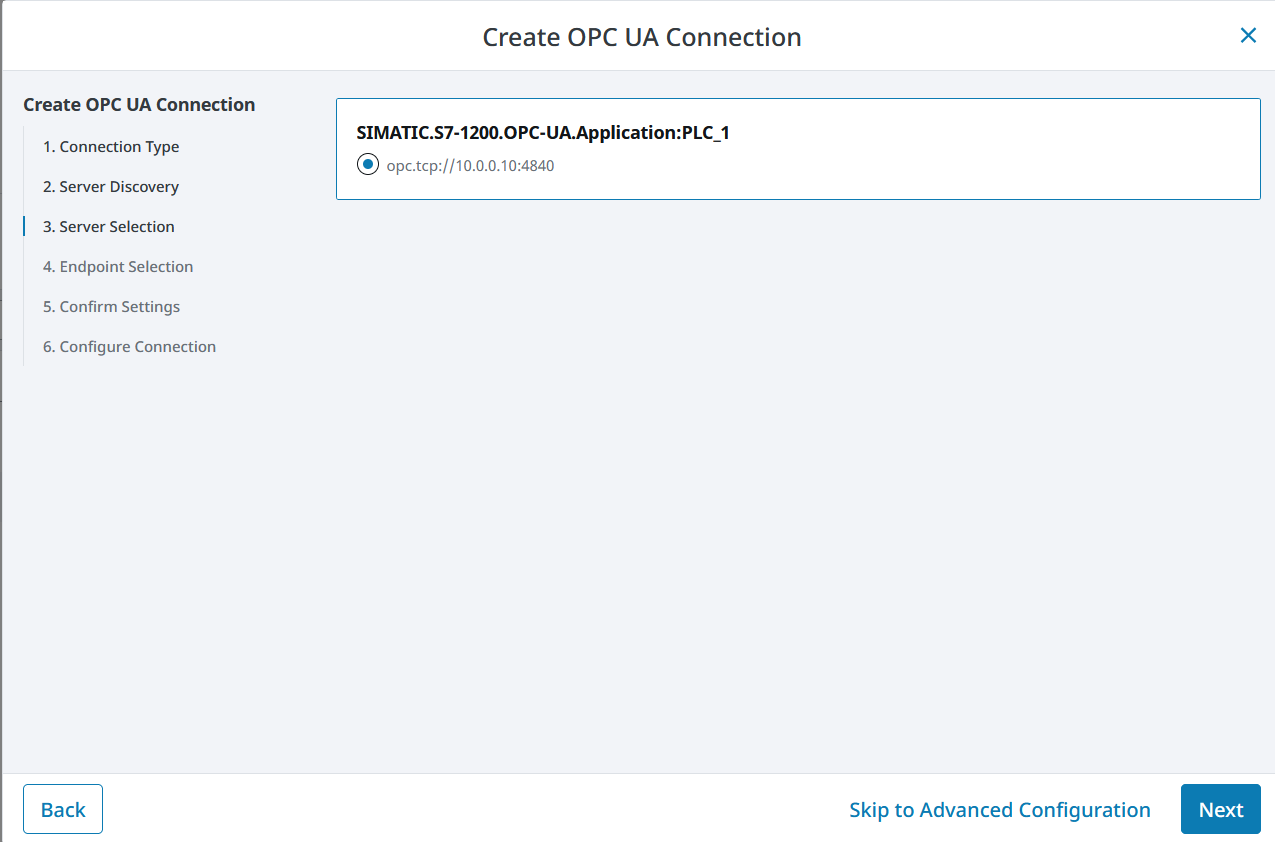
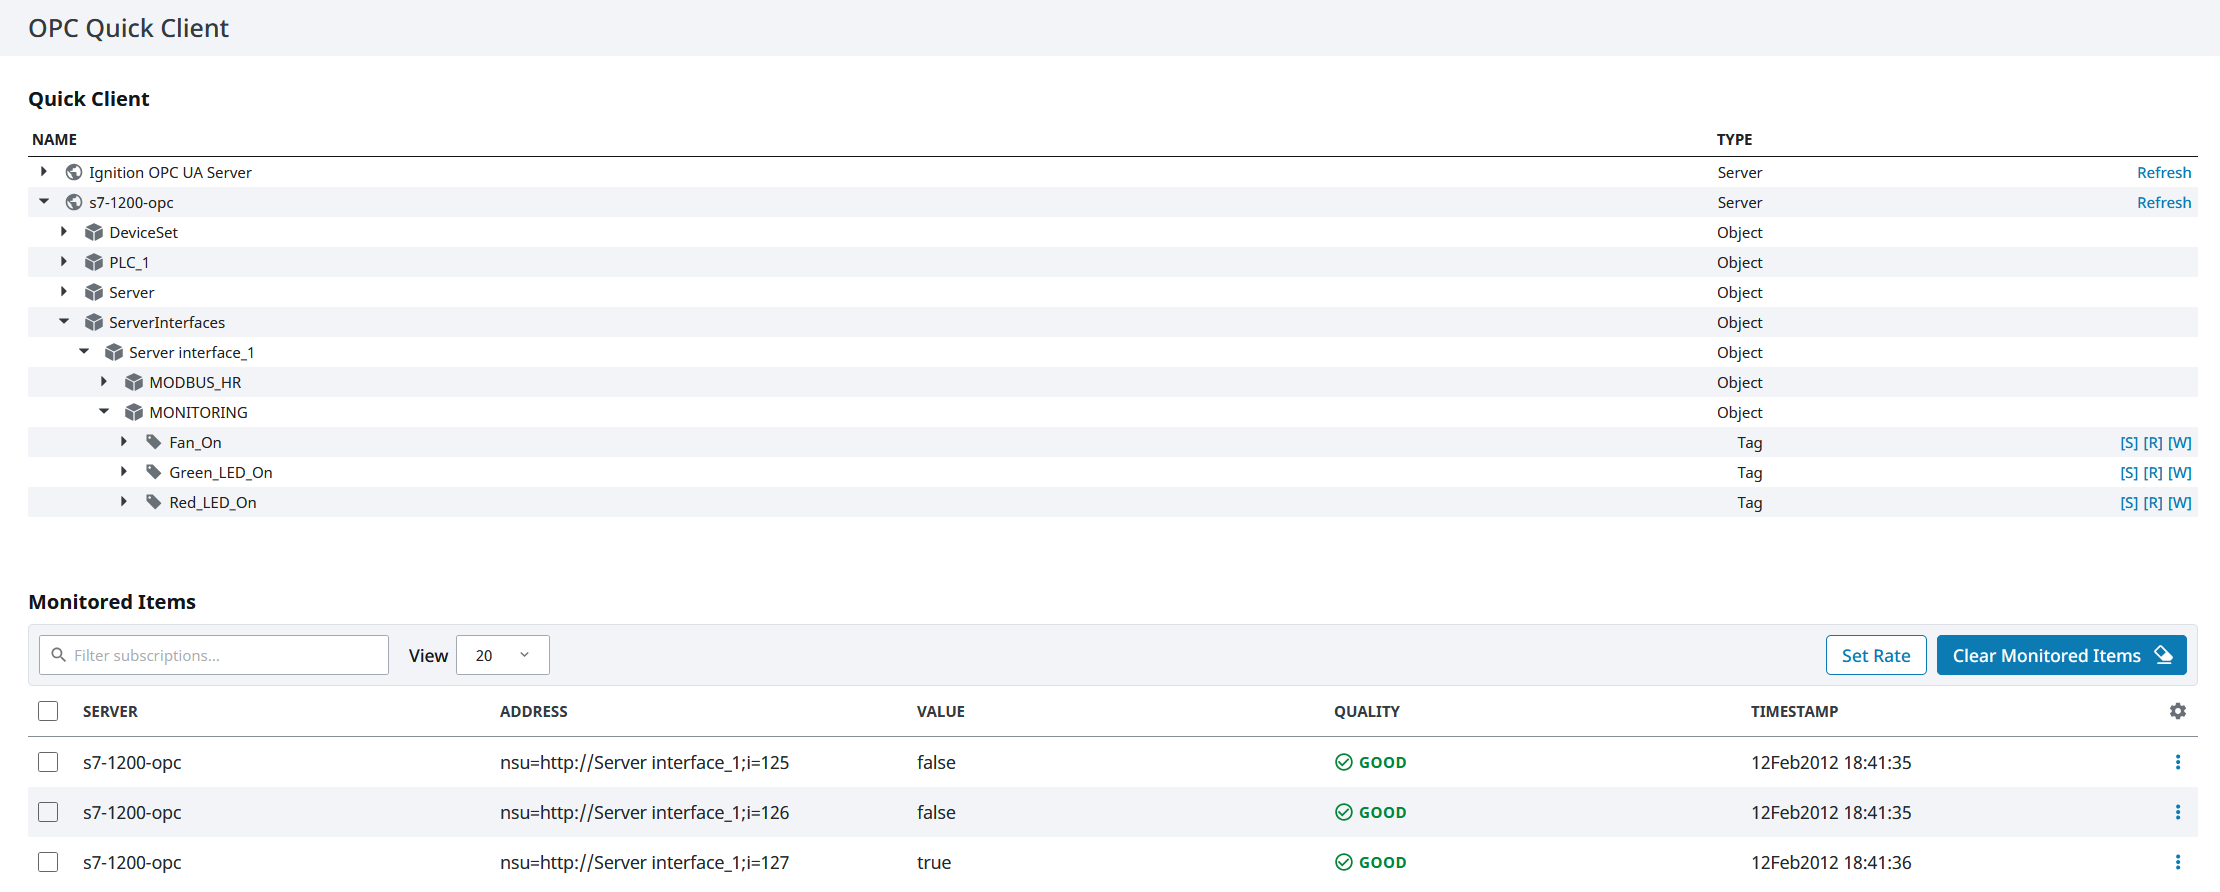
And you’re done. If you navigate to Quick Client you can explore your OPC-UA data.
Why not UNS?
It would be very neat to connect the SCADA system to the PLC via the UNS, but I didn’t do this, for a couple of reasons:
- Ignition Maker Edition doesn’t have MQTT support, so technically, I couldn’t.
- If for some reason the UNS broke, you have lost control and vision of your PLC. Of course, this risk could be mitigated in other manners, but this is one approach.
Creating an HMI
Ignition supports the creation of HMIs via their Designer tool. I won’t delve into great depth about how to use it, since that warrants an entire series of its own - a series I don’t have the expertise to write!
Once the OPC-UA connection was working, I launched Ignition Designer and connected to my Ignition server. Then I created a new project, gave it a name and title (and left everything else default) and opened it up. I could see my tags in the bottom left hand corner and could confirm I was able to read and write them (by switching the read/write mode in the top bar).
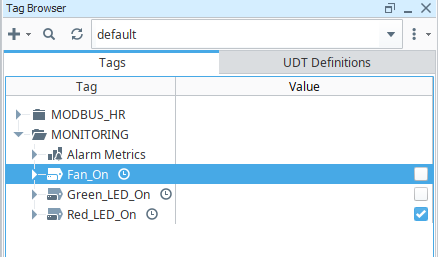
Next, I created a new view and dragged my tags onto it. It was super basic, but did the job of allowing me to control the fan and monitor the LEDs.
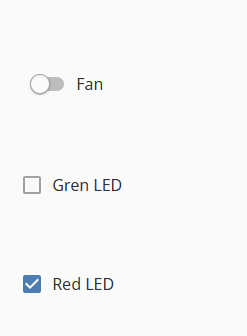
I could then access it via Ignition Perspective (go to your Ignition Webpage -> Perspective -> Click your project) and control my PLC via the HMI!
Historian (InfluxDB 3 Core)
As mentioned above, the historian lets us store data mapped to time stamps, allowing us to retrieve old events and nicely chart values against time.
I found setting up InfluxDB 3 Core to ingest MQTT data a bit of a headache, so I’ve included a fairly comprehensive guide below that will hopefully help you avoid my pain. The guide assumes you’ve got the same docker config that I’m already running.
- I had to fix some permissions since the container wasn’t running as root:
docker exec -u root influxdb3-core chown -R \ $(docker exec influxdb3-core id -u):$(docker exec influxdb3-core id -g) \ /var/lib/influxdb3 - Then, generate an auth token for use during authentication:
docker exec influxdb3-core influxdb3 create token --adminCopy this somewhere secure for the time being.
- Export it, and add it to your local .env file so you don’t have to keep pasting it. Of course, this is a bad idea in a production system!
echo "INFLUXDB3_AUTH_TOKEN=<your-token>" >> .env export INFLUXDB3_AUTH_TOKEN=<your-token> - Then we can create our database. I named mine ‘homelab’ and gave it a retention period of 7 days.
docker exec influxdb3-core influxdb3 create database homelab --retention-period 7d - Next, we have to install the MQTT Subscribe plugin. There are commands to help with plugin installs, but I found it a bit wonky, so we’ll do it manually instead.
curl -o mqtt_subscriber.py \ https://raw.githubusercontent.com/influxdata/influxdb3_plugins/main/influxdata/mqtt_subscriber/mqtt_subscriber.py docker cp mqtt_subscriber.py \ influxdb3-core:/var/lib/influxdb3/plugins/mqtt_subscriber.py - We also need to install some dependencies for the plugin:
docker exec influxdb3-core influxdb3 install package \ --plugin-dir /var/lib/influxdb3/plugins \ jsonpath-ng docker exec influxdb3-core influxdb3 install package \ --plugin-dir /var/lib/influxdb3/plugins \ paho-mqtt - Then we can create our configuration file
mqtt_config.toml:[mqtt] broker_host = "hivemq-ce" broker_port = 1883 topics = ["/neuron/mqtt-json"] qos = 1 [mapping.json] table_name = "plc_monitoring" timestamp_field = "$.timestamp:ms" [mapping.json.tags] node = "$.node" group = "$.group" [mapping.json.fields] fan_on = ["$.values.Fan_On", "bool"] green_led_on = ["$.values.Green_LED_On", "bool"] red_led_on = ["$.values.Red_LED_On", "bool"] operating_mode = ["$.values.OperatingMode", "int"]Since our broker is running on the same server, we can reference it by its container name,
hivemq-ce, otherwise this would have to be an IP or FQDN. Topics and mappings will also differ depending on your chosen naming structure. If you’re unsure, have a look at the data in the broker using a tool like MQTT Explorer. - Copy the config file into the container:
docker cp mqtt_config.toml \ influxdb3-core:/var/lib/influxdb3/plugins/mqtt_config.toml - Finally, we create and enable the trigger. This tells the historian how to pull the data in:
docker exec influxdb3-core influxdb3 create trigger \ --database homelab \ --plugin-filename mqtt_subscriber.py \ --trigger-spec "every:10s" \ --trigger-arguments "config_file_path=mqtt_config.toml,enable_full_logging=true" \ mqtt_ingest docker exec influxdb3-core influxdb3 enable trigger \ --database homelab \ mqtt_ingest - Now wait 30 seconds and then run the following to see if data is flowing in:
watch -n 5 "docker exec influxdb3-core influxdb3 query \
--database homelab \
'SELECT time, fan_on, green_led_on, red_led_on, operating_mode \
FROM plc_monitoring ORDER BY time DESC LIMIT 1'"
If no data is appearing, you can check the logs using this:
docker exec influxdb3-core influxdb3 query \
--database homelab \
--format json \
"SELECT * FROM system.processing_engine_logs ORDER BY event_time DESC LIMIT 10"
Gotcha: exit code 132 on Proxmox
One annoying error I ran into was an exit code 132 every time I tried to start the container. This ended up being related to the proxmox CPU architecture. It was solved by changing the host VM’s CPU type to host rather than kvm64.
Viewing Data
We’ll take a look at how we can start to visualise the data in the next part of this series, where we set up Grafana in our IT network!
Final Thoughts
Through this article we’ve looked at how to set up Ignition to work as a SCADA system over OPC-UA. We’ve also dived deep into setting up our historian to pull data out of the UNS system.
In the next article, we’ll look at how we can visualise that historian data to be used by the business.